 |
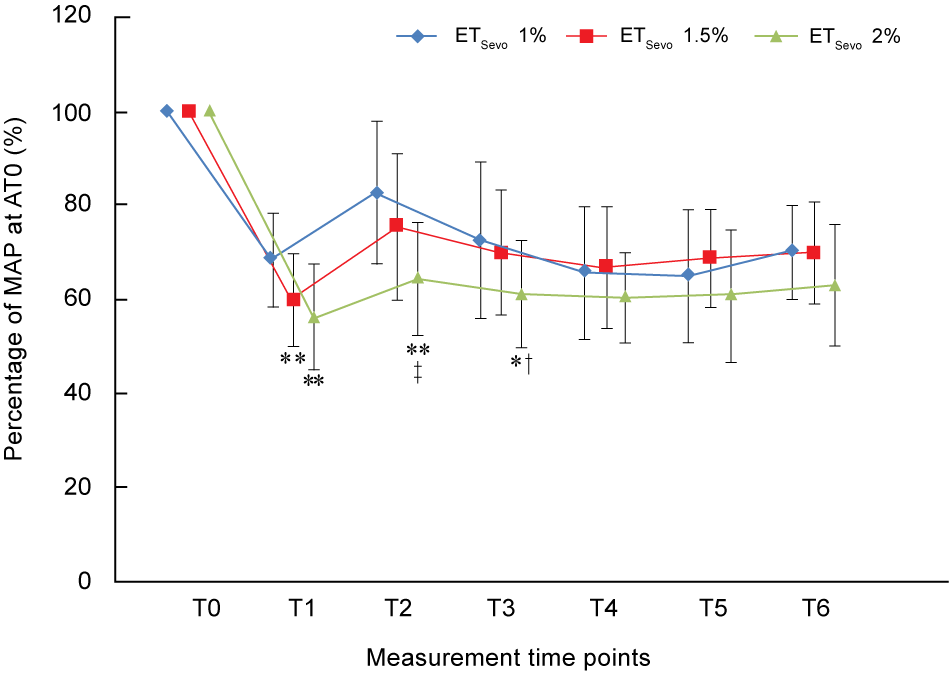
| Figure 3: Changes in MAP relative values. MAP was calculated as a relative value (%) with respect to T0 (100%). Values are expressed as mean ± standard deviation. * P < 0.05, ** P < 0.01 compared with the ETSevo 1% group; † P < 0.05, ‡ P < 0.01 compared with the ETSevo 1.5% group. MAP: mean arterial pressure; ETSevo: end-tidal sevoflurane; T0: before induction of anesthesia (baseline); T1: immediately before tracheal intubation; T2: immediately after tracheal intubation; T3: 3 min after tracheal intubation; T4: 5 min after tracheal intubation; T5: 10 min after tracheal intubation; T6: 15 min after tracheal intubation. |