 |
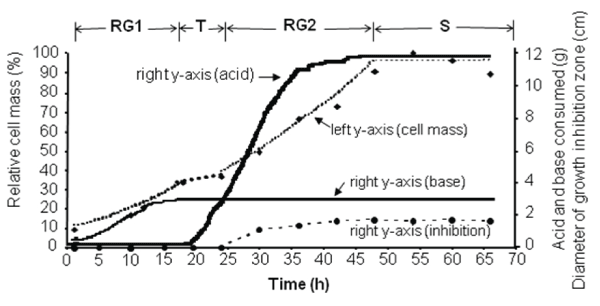
| Figure 1: Growth curve of S. tenjimariensis in relation to acid and base consumption and bioactivity. Data are average values from two independent bioreactor experiments. Major stages of growth are marked as rapid growth 1 (RG1), transition (T), rapid growth 2 (RG2), and stationary (S). |