 |
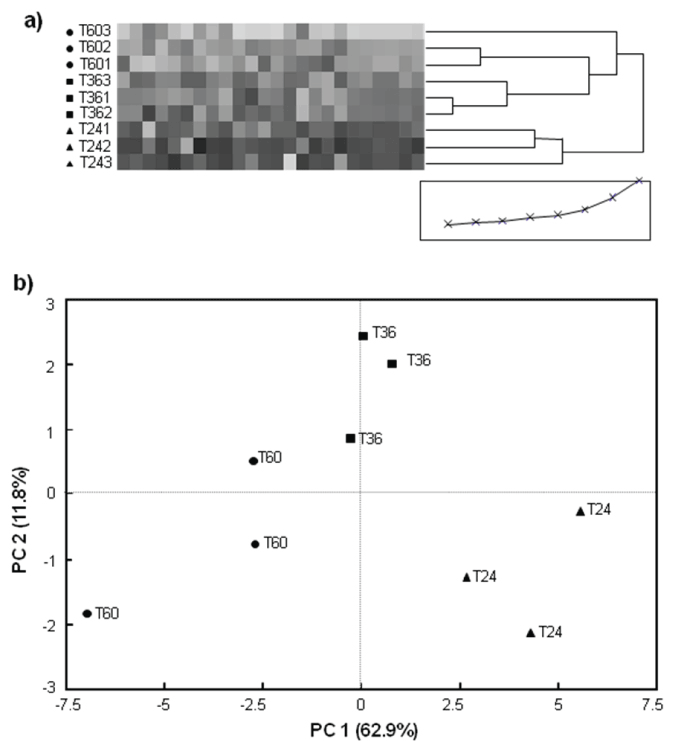
| Figure 5: Multivariate analysis of 24 representative metabolites measured from the liquid culture of S. tenjimariensis sorted by time points. Normalized data of metabolite profiles for 3 replicate samples were arranged and visualized using a) HCA and b) PCA. In Figure 5a, T603, for example, stands for the 6 h sample replicate-3 while T363 stands for the 36 h sample replicate-3. In Figure 5b, T36, for example, stands for the 36 h sample. |