 |
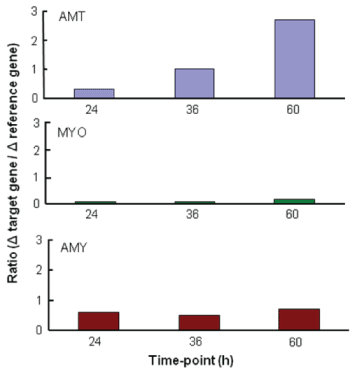
| Figure 8: Preliminary qPCR results for AMT, MYO, and AMY genes. Calculations based upon Pfaffl formula [30]. The time 10 h sample was used as a control and compared against the time 24 h, 36 h and 60 h samples. 16S was the reference gene. Data represents one replicate of each sample and three data point standard curves. AMT standard curve correlation coefficient (cc) = 0.999, PCR efficiency = 97.2%; MYO (cc) = 1.000, PCR efficiency = 64.0%; AMY (cc) = 0.956, PCR efficiency = 125.8%; 16S coefficient (cc) = 1.000, PCR efficiency = 97.2%. |