 |
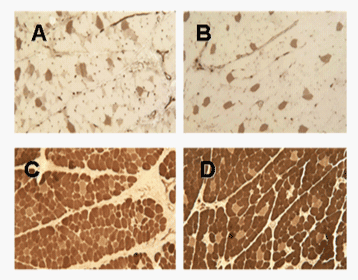
| Figure 7: Comparison of muscle fiber types from operated (left) and nonoperated (right) tibialis anterior muscles. (A) and (B) show ATPase staining patterns prepared at pH 4.35, which results in a darker appearance for type I fibers; (C) and (D) show ATPase stains of the same regions prepared at pH 10.2, which results in a lighter appearance for type I fibers. Images like these were analyzed by the Histotechnology Core Facility to provide the data presented in Tables 2 and 3. In the A, B and C, D image pairs, changes in the fiber-type distribution are ev. |