 |
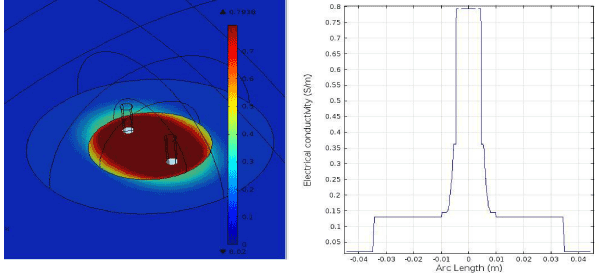
| Figure 4: Electrical Conductivity Distribution in Cancerous regions at the end of the Pulse Application; Left: Surface Plot of Electrical Conductivity Distribution in Tumor; Right: Electrical Conductivity Distribution along the Electrode Tips through the Tissue. |