 |
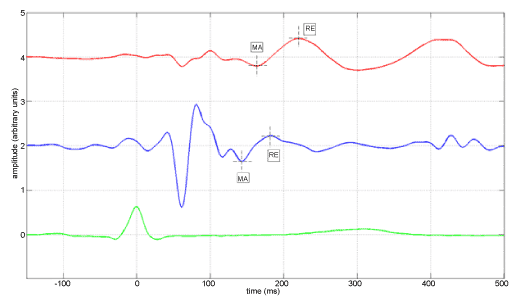
| Figure 5: Measurements of the exhalation phase while the subject is supine. The annotated superior-inferior axis SCG signal (red, on top), the annotated dorsoventral SCG signal (blue, in the middle), and the ECG signal (green, in the bottom). Annotations: Maximum acceleration of blood in the aorta (MA) and onset of rapid ejection of blood into the aorta (RE). |