 |
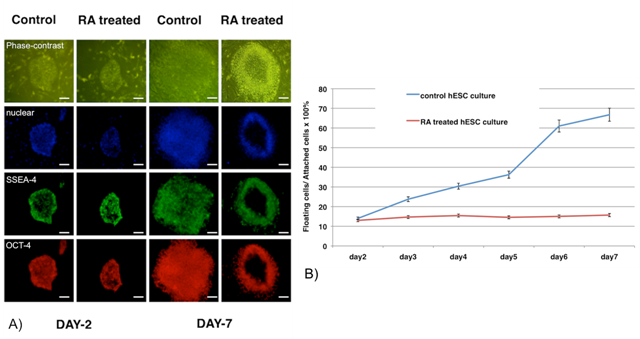
| Figure 5: (5a) Human embryonic stem cell colony on day 2 and day 7 after passage in control and retinoic (RA) treated cultures. On the day 2 the stem cell colony of comparable size and morphology (left). RA treated results in loss of pluripotent genes as seen in loss of OCT-4 (red) and SSEA-4 (green). Scale bar represents 100 µm. (5b) the percentage of floating cells from control and retinoic acidtreated hESC cultures. Floating cells from control and RA treated hESC culture from day 2 to day 7 after passage were collected, counted and represented as floating cells/ attached cells × 100. |