 |
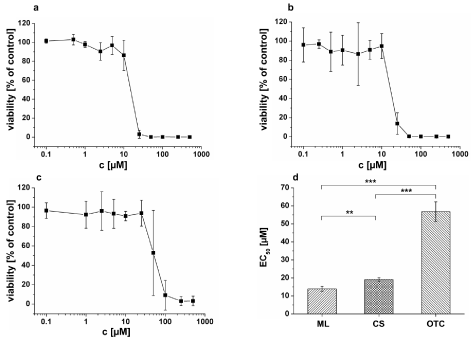
| Figure 7: Dose response curves for HepG2 cells cultivated in a) monolayer (ML) b) collagen-sandwich (CS) and c) organotypic cultures (OTC) d) EC50 values of tamoxifen (24 h exposure). EC50 values were calculated using Boltzmann function. Viability was assessed by alamar blue assay and calculated relative to the respective untreated controls. Error bars indicate ąSD (N=3, n=3), ** significance at p < 0.01, *** significance at p < 0.001. |