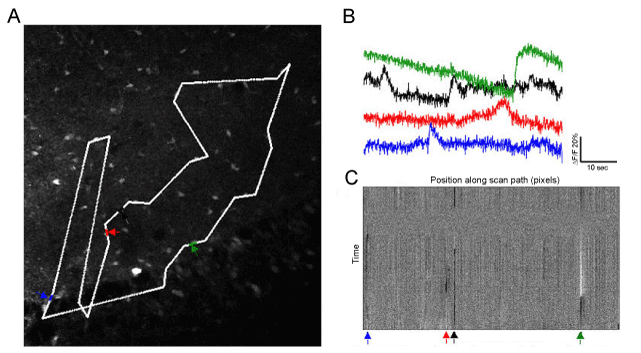
A) An example TPS line scan targeting Indo-1 labeled astrocytes in the hippocampus. Colored arrows (gray, blue, red, and green) indicate the position of four different labeled cells in the chosen scan. In this case, there were few labeled neurons in the pyramidal cell layer toward the lower part of the image indicating a preference of Indo-1 for astrocytes.
B) Examples of calcium transients recorded with the two-photon microscope using TPS. The four colors correspond to the astrocytes in Figure 4.
C) Raw data from TPS experiment. The horizontal axis contains all the pixels of individual line scans displayed as a line. The vertical axis is time; each line corresponding to one scan and with time progressing from top to bottom. The locations of the four cells are marked with color-coded arrows at the bottom.