 |
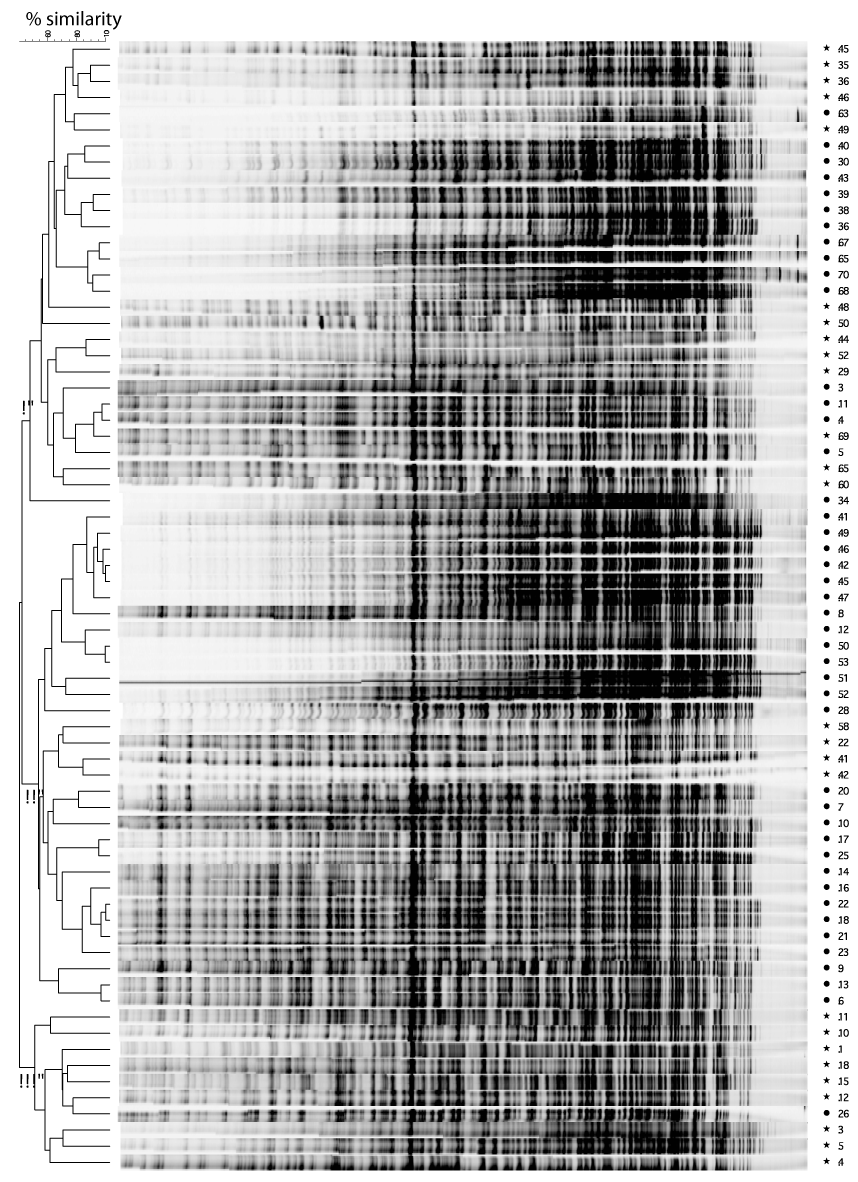
| Figure 4: AFLP patterns of Vibrio vulnificus isolates recovered from oysters. The dendogram was derived by UPGMA cluster analysis of the AFLP profiles of 70 V. vulnificus isolates. The tracks show the processed band patterns after conversion, normalization, and background subtraction. Levels of linkage are expressed as the Pearson product-moment similarity coefficient. Major clusters are noted with roman numerals. Star symbols represent pre-depuration isolates while solid circles represent post-depuration isolates. |