 |
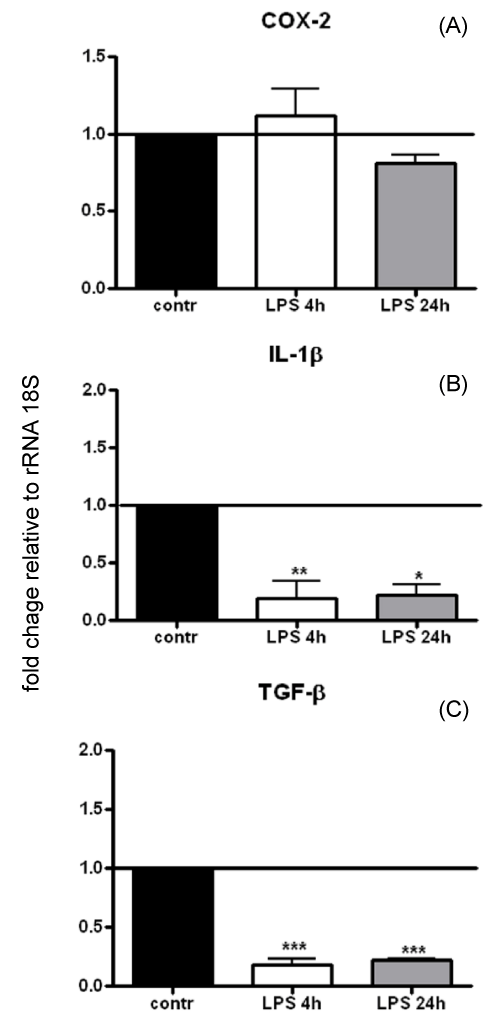
| Figure 1: DLEC stimulation with LPS. IL-1β (A), COX-2 (B) and TGF-β (C) mRNA levels were normalised to rRNA 18 levels in the same samples after real-time PCR quantitative analysis of DLEC stimulated with PBS (control) and with 5 µg/ml LPS for 4 and 24 h and calibrated against the non-stimulated 0 h control. Data were expressed as the mean ± SD; one asterisk indicates when p<0.05 with respect to the time 0 control; two asterisks indicate when p<0.01 with respect to the time 0 control and three asterisks indicates when p<0.0001 with respect to the time 0 control. |