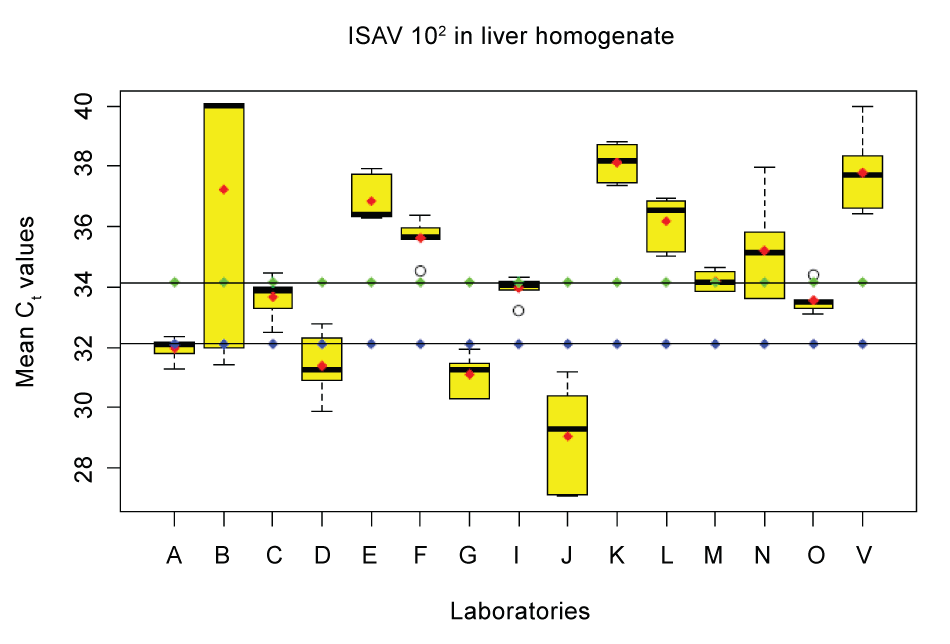
Figure 2: Each box plot represents the relation to the maximum, the
minimum, the mean ( ), the median (-) as well as the Inter-Quartile
range ( ), the median (-) as well as the Inter-Quartile
range ( ) of the Ct values for each lab, the error bars represent the
lowest and the highest Ct value. Also shown are the extreme values
(o). The line with (- ) of the Ct values for each lab, the error bars represent the
lowest and the highest Ct value. Also shown are the extreme values
(o). The line with (- -) is the reference lab for ISA at AVC median
Ct value and the line with (- -) is the reference lab for ISA at AVC median
Ct value and the line with (- -) represents the overall median for all
laboratories. -) represents the overall median for all
laboratories. |

