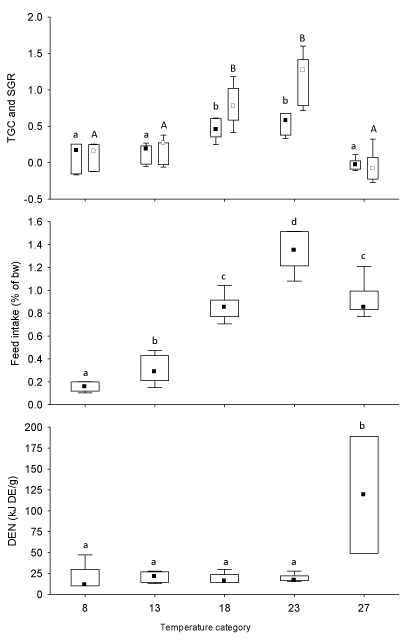
and energy requirement (DEN, kJ DE•g-1) of Eurasian perch (Perca fluviatilis)
in different temperature categories (8, 13, 18, 23 and 27°C). Square symbols
within boxes represent the median of the sample (white square symbols for
SGR and black square symbols for TGC), boxes represent quartiles and the
whiskers show non-outlier range. Identical lower and upper case letters indicates
no significant differences (P>0.005) between temperature categories.
For growth rates (SGR and TGC) and feed intake, number of replicates in
temperature categories 8-23°C were six and in category 27°C five. For the
energy requirement (DEN) data, numbers of replicates were four in temperature
category 8 and 13°C, and six in categories 18 and 23°C.