 |
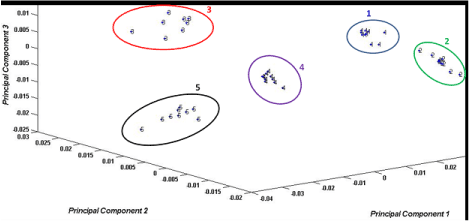
| Figure 2: Principal Component Analysis for PI values of sturgeon. Fish were sorted into different maturity levels using the following groupings: group 1: 0.05<PI<0.10; group 2: 0.10<PI<0.15; group 3: 0.15<PI<0.20; group 4: 0.20<PI<0.25; group 5: PI>0.25. In this three-dimensional (3D) unsupervised PCA model, each point represents one sturgeon plasma sample (average spectra (N=30)) randomly selected from both Idaho and California fish during Period I and II (2007-2009). This cluster analysis model was validated by using fish collected in 2010 from California and is a representative of one of the ten models developed (N=10). Each maturity level group was well separated (P<0.05) and tightly clustered with interclass distances ranging from 6.49 to 21.64 based on Mahalanobis distance measurements computed between the centroids of the clusters. A Mahalanobis distance of >3 indicates good segregation [18]. |