 |
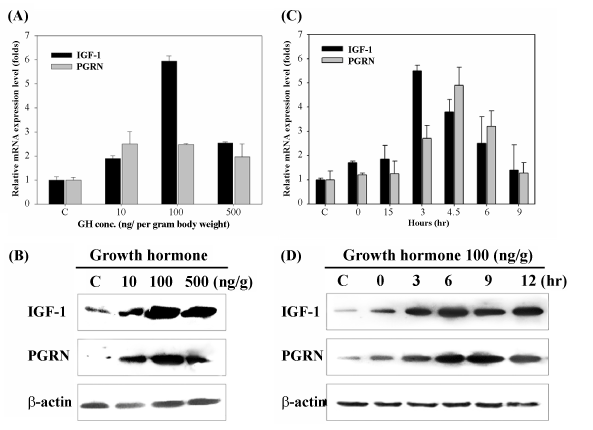
| Figure 1: PGRN and IGF-1 were co-induced in the zebrafish liver by GH treatment. The dose response of PGRN and IGF-1 mRNA (A) and protein (B) after different doses of GH (10, 100 and 500 ng/g body weight) i.p. injection were determined by quantitative PCR and western blotting. Liver tissues were sampled at 3 h after GH treatment. The time course of PGRN and IGF-1 mRNA (C) and protein (D) expression after i.p. injection with 100 ng/g body weight of GH were determined by quantitative PCR and western blotting. β-actin was used as a loading control for normalization. |