 |
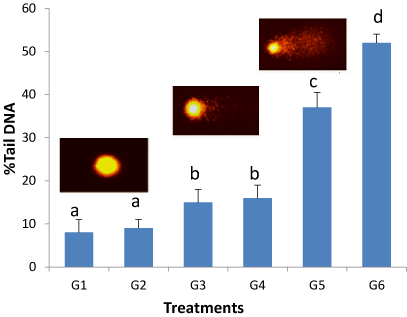
| Figure 1: Induction of DNA single strands breaks (represented as percentage tail DNA) in C. carpio erythrocytes following 60 days exposure to different concentrations of AFB1 contaminated diets and to AFB1 plus β-glucan. Values are mean ± S.E. alphabetic letters indicate significant difference at P<0.05; n=6. G1-(Control diet); G2-(fed diet containing 1% β-glucan); G3-(fed diet containing 4 mg AFB1 kg dw-1 plus1% β-glucan; G4-(fed diet containing 6 mg AFB1 kg dw-1 plus 1% β-glucan); G5-(4 mg AFB1 kg dw-1); G6-(6 mg AFB1 kg dw-1). |