 |
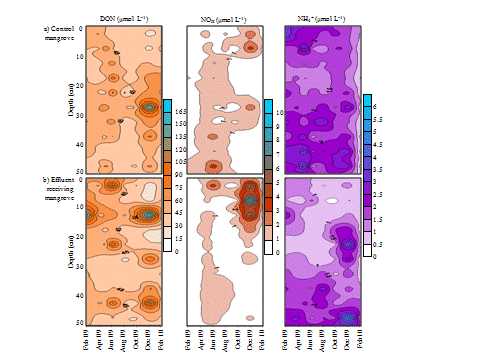
| Figure 7: Temporal and depth evolution of the concentrations in DON, NOX and NH4 + (means of tree replicates) in pore-waters in the control mangrove (a) and in the effluent receiving mangrove (b). Graphical representation was performed under Surfer 8, with Krigging interpolation method for extrapolating values between sampling periods. |