 |
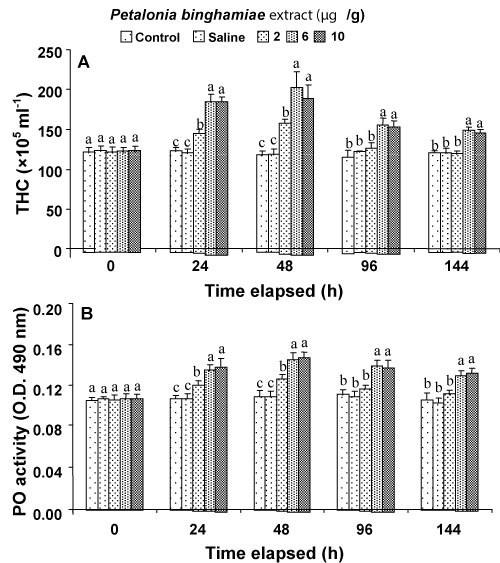
| Figure 3: Mean (± SE) THC (A) and phenoloxidase activity (B) of white shrimp Litopenaeus vannamei received Petalonia binghamiae extract at 2, 6, and 10 μg/g, shrimp received saline, and the control shrimp. Each bar represents mean value from eight shrimp with standard error. Data at the same exposure time with different letters are significantly different (p<0.05) among treatments. |