 |
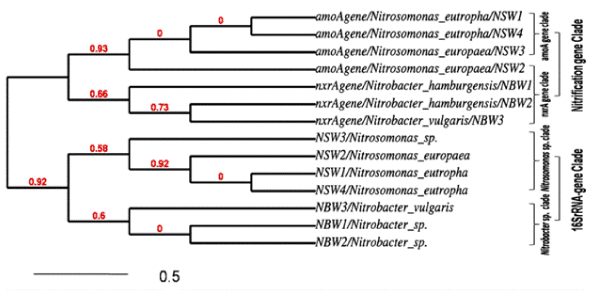
| Figure 5: Phylogenetic distance tree displaying the Maximum likelihood pattern of Nitrosomonas and Nitrobacter sp. Specific gene clad3s, compared with 16S rRNA gene, where a lineage shared by different species as well genes through Bayesian Interference theory on the basis of Markov chain model and their bootstrap value. |