 |
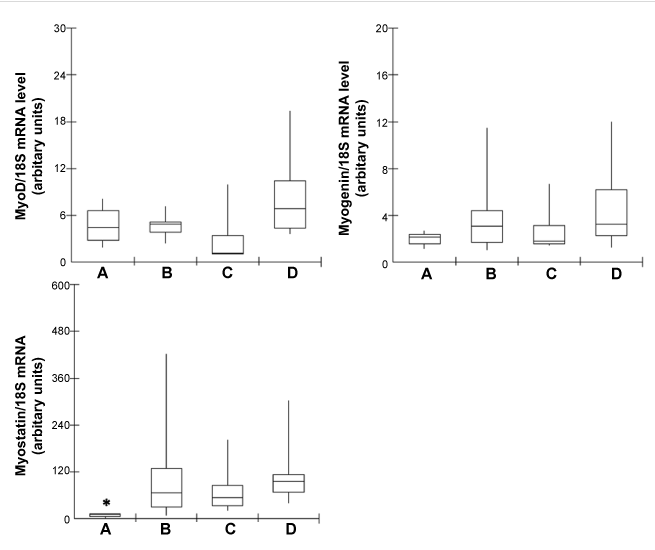
| Figure 3: MyoD, myogenin and myostatin mRNA estimated levels in white skeletalmuscle of pirarucu (A. gigas) during growth. Data were normalized to 18Sribosomal RNA expression values. Data are presented as minimum, 1st quartile,median, 3rd quartile and maximum values. Group A: up to 50 g weight, Group B: from 50 to 400 g weight, Group C: from 400 g to 5 kg weight, Group D: from 5 to 9 kg weight. (*) Statistical difference at 5% significance (Group A compared to B, C and D). |