 |
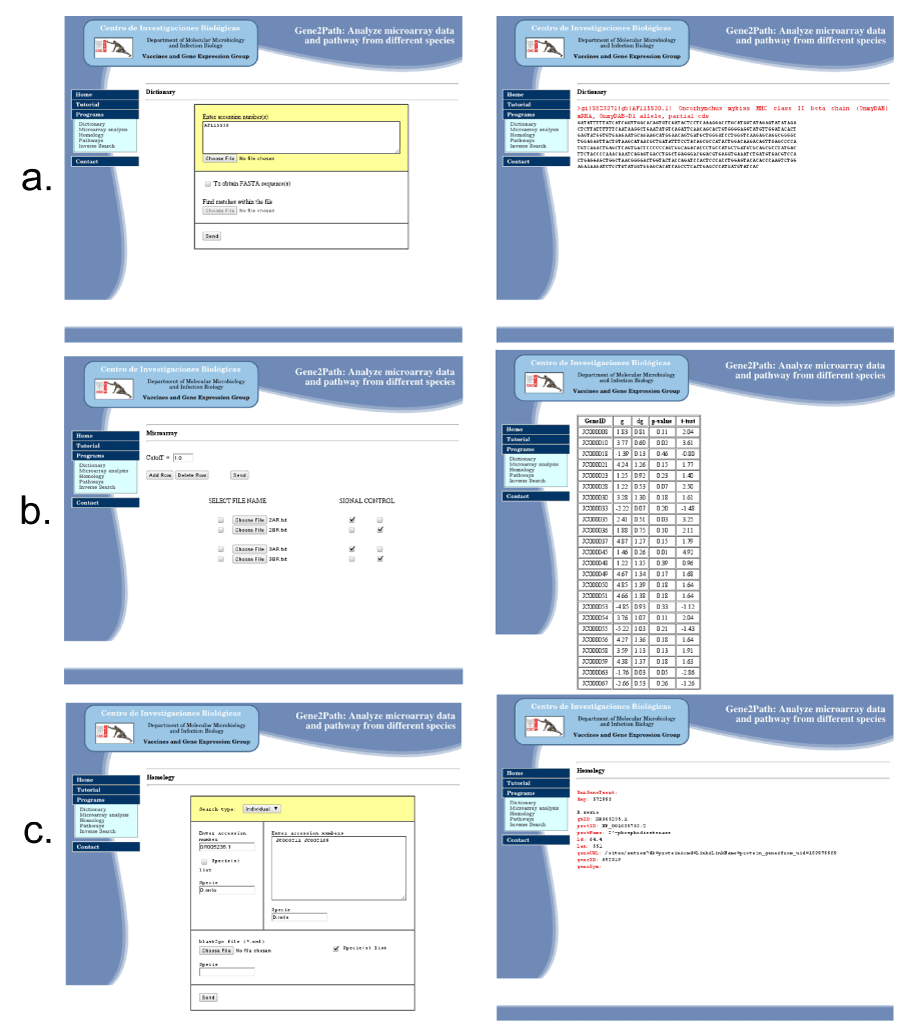
| Figure 2: Illustrates the web tutorial of Gene2Path program. Successive images of the screens are shown (a) Dictionary step. (b) Normalization step. Values from the “g” signal process file in the “.txt” format were used. Data files correspond to control or experimental groups, and the gene expression fold with their t-test paired p-value. (c) Orthology step: Searching through NCBI. |