 |
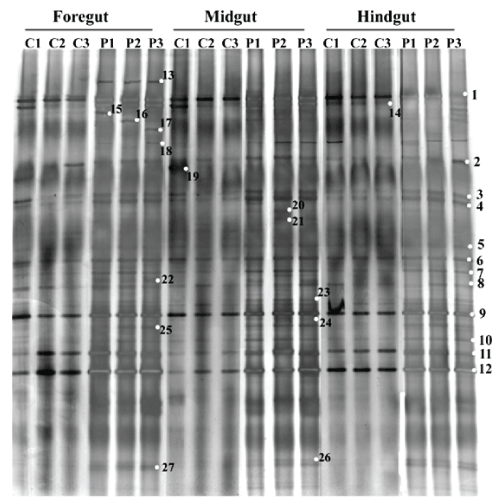
| Figure 1: DGGE profiles of the foregut, midgut and hindgut samples in Epinephelus coioides fed the control diet and probiotic diet for 60 days. C1, C2 and C3 represent the three fish fed the control diet, while P1, P2 and P3 represent the three fish fed the probiotic diet. Band 1-12 are common bands to all samples, band 14 and 19 are present only in the control group, while band 13, 15-18, 20-27 only in the probiotic group. Those bands are sequenced and described in Table 2. |