 |
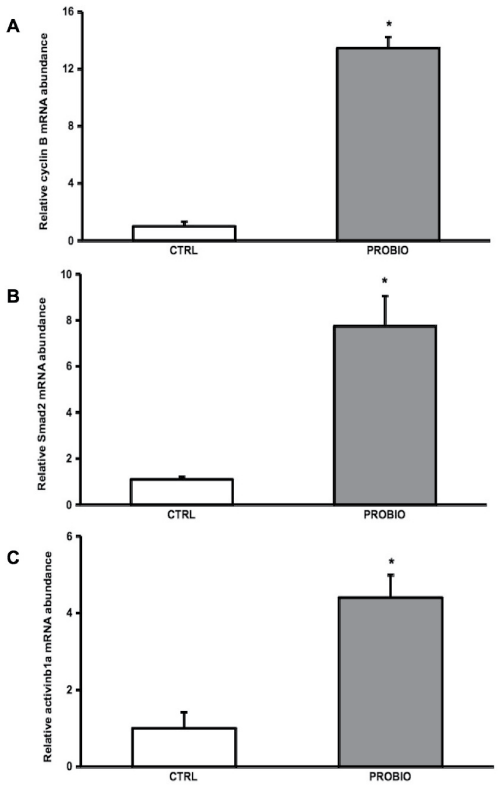
| Figure 4: (A) cyclin B (B) smad2 and (C) activin βA1 mRNA levels in the ovary, normalized against arp genes, in zebrafish females fed on L. rhamnosus IMC 501® (PROBIO) and control diet (CTRL). Data are presented as mean values expressed as ratio to control (n = 10) ± standard deviation (SD). Asterisks de- note significant differences from the control group (P < 0.05). |