 |
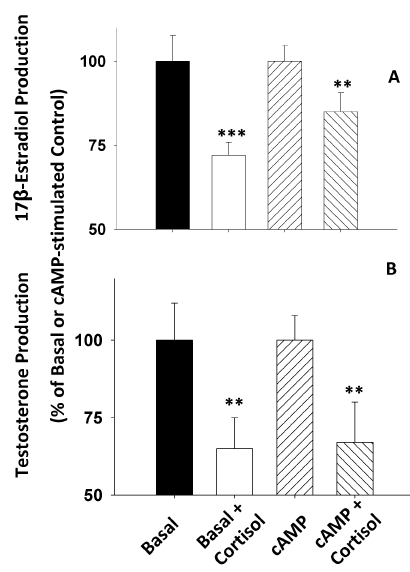
| Figure 2: Affect of cortisol on (A) 17b-estradiol (E2) and (B) testosterone (T) production by mid-vitellogenic follicles during basal and cAMP-stimulated steroidogenesis. The data are shown as mean % hormone production relative to the relevant control ± SEM (n = 18). Mean basal and cAMP-stimulated E2 production were 0.78 ± 0.06 and 1.05 ± 0.05 pg.follicle-1, respectively; these differed significantly (P < 0.01) from one another. The mean basal and cAMPstimulated T production were 0.46 ± 0.05 and 5.29 ± 1.68 pg.follicle-1, respectively; these differed significantly (P < 0.01) from one another. **, *** indicate significant differences (P < 0.01 and 0.001, respectively) from the relevant cortisol-treated groups. |