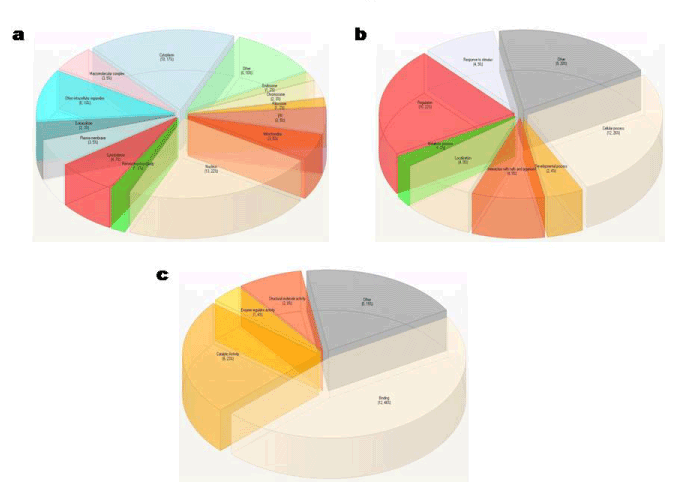
The sub-panels a denotes cellular component analysis of the differentials.
The sub-panels b denotes biological process analysis of the differentials.
The sub-panels c denotes molecular function analysis of the differentials.
 |
| Figure 1: The images depict representative pie diagram of STRAP analysis
of the differentials identified during normal and failed spermiation condition by
LC-MS/MS. The sub-panels a denotes cellular component analysis of the differentials. The sub-panels b denotes biological process analysis of the differentials. The sub-panels c denotes molecular function analysis of the differentials. |