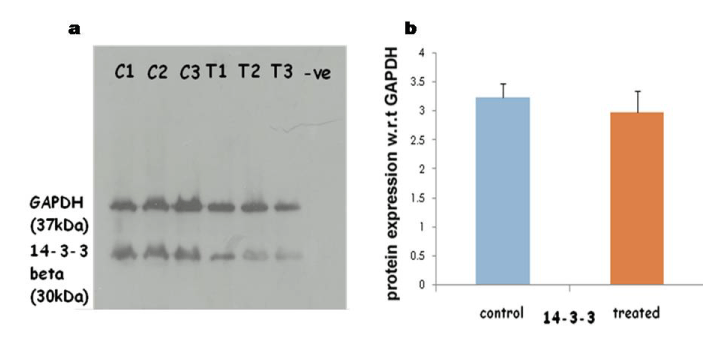
Panel a represents western blot of the 14-3-3 beta (30 kDa) and GAPDH (37 kDa, loading control) protein from tubules at stages VII-VIII in control group and treated group. –ve denotes negative control without primary antibody. Data of three animals are shown (3 control and 3 treated).
Panel b denotes graphical representation of the relative expression of 14-3-3 beta w.r.t loading control GAPDH.