 |
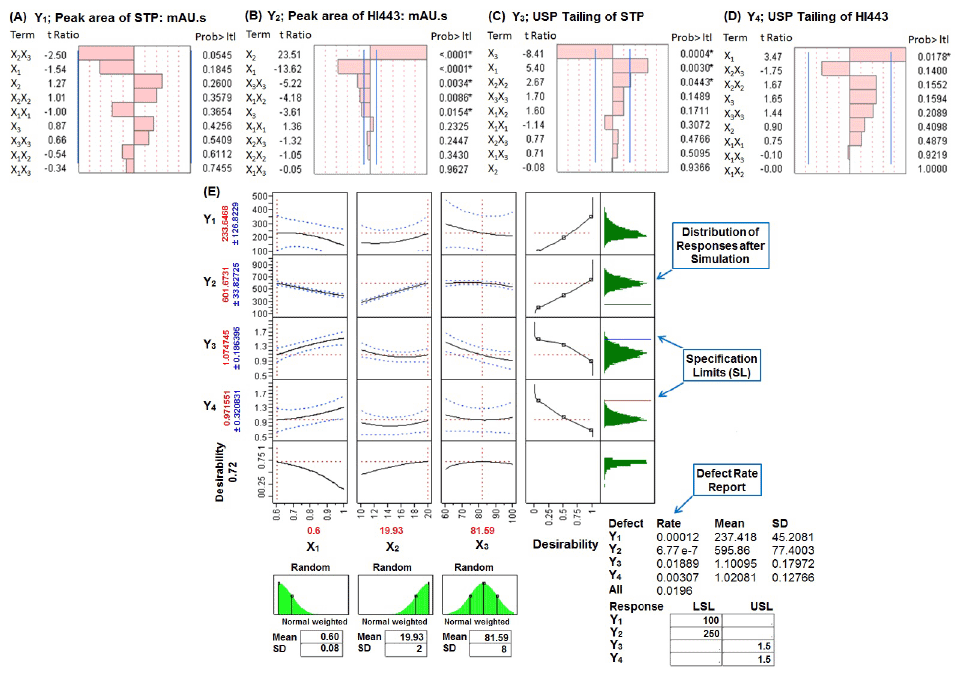
| Figure 4: Pareto charts showing the standardized effect of factors, X1 flow rate: mL/min, X2 injection volume: µL, X3 initial gradient acetonitrile ratio: % v/v, in Box- Behnken (BB) design for the responses: (A) Y1 peak area of STP: mAU.s, (B) Y2 peak area of HI443: mAU.s, (C) Y3 USP Tailing of STP, (D) Y4 USP Tailing of HI443. Bars extending past the vertical lines indicates the values reaching statistical significance (α=0.05). (E) Prediction profiler, desirability plot and simulation analysis showing the effect of factors, X1, X2, X3, and X4 in BB design for the responses, Y1, Y2, Y3, and Y4. Asterisk (*) indicates the significant effect (p<0.05). |