 |
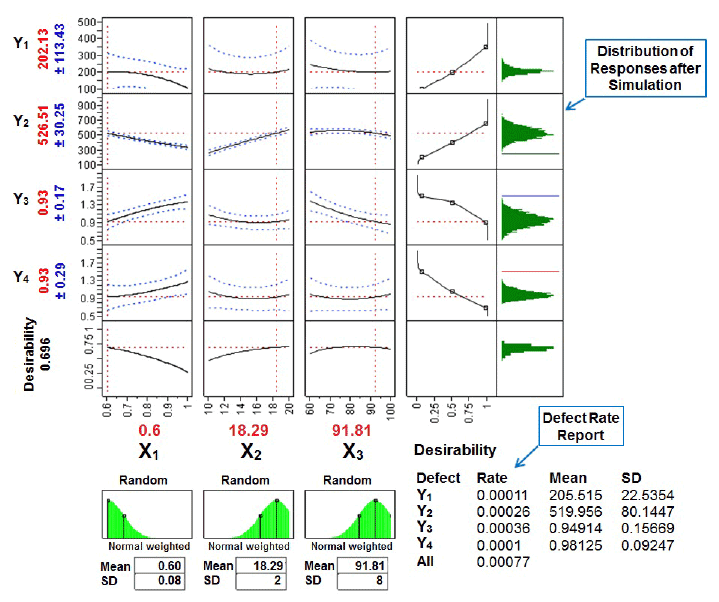
| Figure 6: Prediction profiler, desirability plot and defect rate after Monte Carlo simulation, showing the effect of factors, X1 flow rate: mL/min, X2 injection volume: µL, X3 initial gradient acetonitrile ratio: % v/v, for the responses, Y1 peak area of STP: mAU.s, Y2 peak area of HI443: mAU.s, Y3 USP Tailing of STP, and Y4 USP Tailing of HI443. |