 |
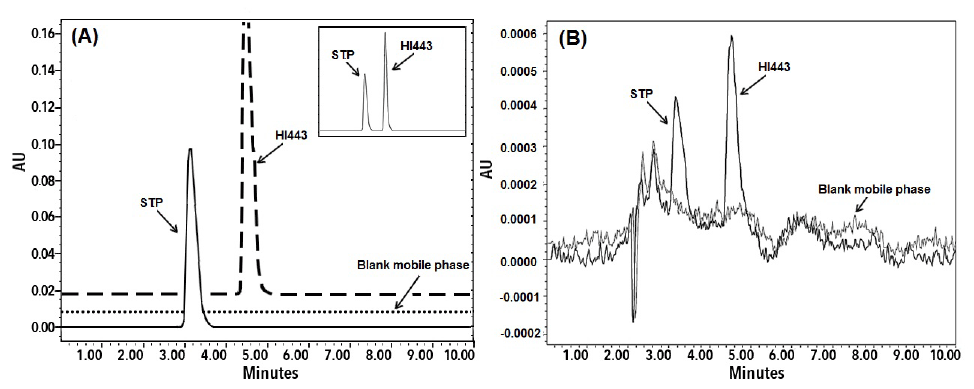
| Figure 7: A) Representative HPLC chromatogram of STP (10 µg/mL) and HI443 (5 µg/mL). The Figure in insert shows the HPLC chromatogram of the sample containing STP and HI443. (B) HPLC Chromatogram representing the peaks of STP (0.195 µg/mL) and HI443 (0.098 µg/mL) at their LOQ level. |