 |
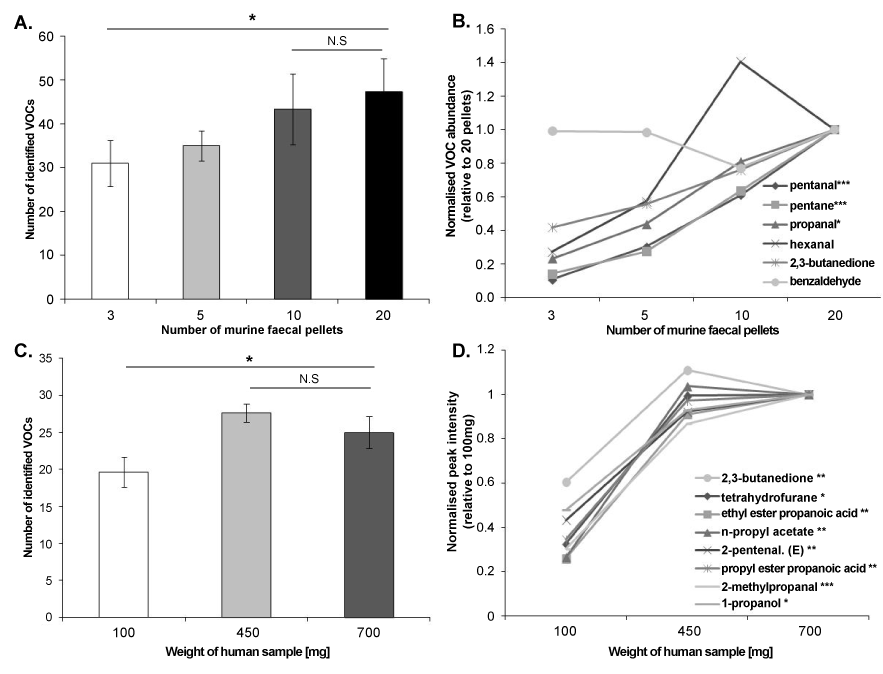
| Figure 1: Sample mass optimisation.(A-B) The number and abundances of volatile organic compounds (VOCs) identified in murine faecal samples of 3, 5, 10 and 20 pellets, with VOC abundances normalized to their abundances in samples of 20 pellets. (C-D) Human faecal samples of 50, 100, 450 and 700 mg (n=3/group), with VOC abundances normalised to their abundances in 700 mg samples; ANOVA with Tukeys HSD followed by Bonferroni; *p<0.05, **p<0.01 and ***p<0.001. |