 |
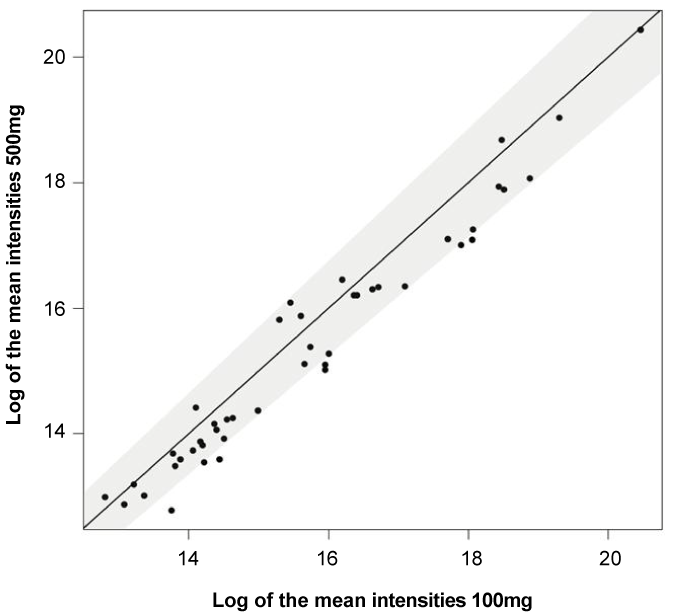
| Figure 2: Abundances of volatile organic compounds (VOCs) in samples of 50 and 100 mg. Scatterplot comparing the average log values of VOCs abundances from human faecal samples of 50 and 100 mg (n=4). The diagonal black segment represents the function x=y, where compounds detected at similar levels between 50 and 100 mg are located inside of the 5% tolerance region represented by the grey area. |