 |
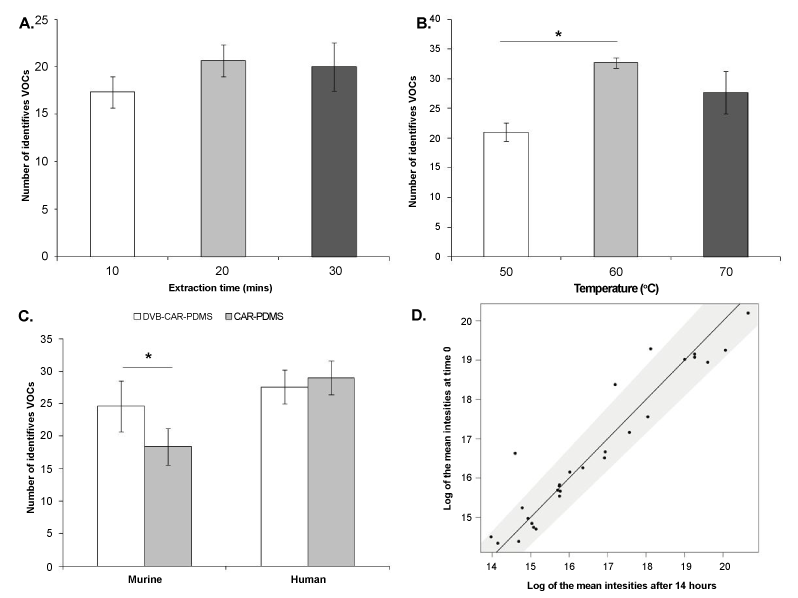
| Figure 4: Solid phase micro-extraction (SPME) optimisation and volatile organic compound (VOC) abundances in samples left for 14 hours at 1°C. The number of VOCs identified in murine faecal samples according to the (A) extraction time and the (B) temperature applied to SPME coupled to gas chromatography- mass spectrometry (GC-MS) analysis (n=3); ANOVA with Tukeys HSD followed by Bonferroni. (C) The number of VOCs identified in murine and human faecal samples according to the SPME fibre used (n=3); T-test. (D) Scatterplot comparing the average log values of VOC abundances from human faecal samples analysed straight after leaving the -20°C freezer and after 14 hrs at 1°C(n=3). The diagonal black segment represents the function x=y, where compounds detected at similar levels between time 0 and time 14 are located inside of the 5% tolerance region represented by the grey area.*p<0.05, **p<0.01 and ***p<0.001. |