 |
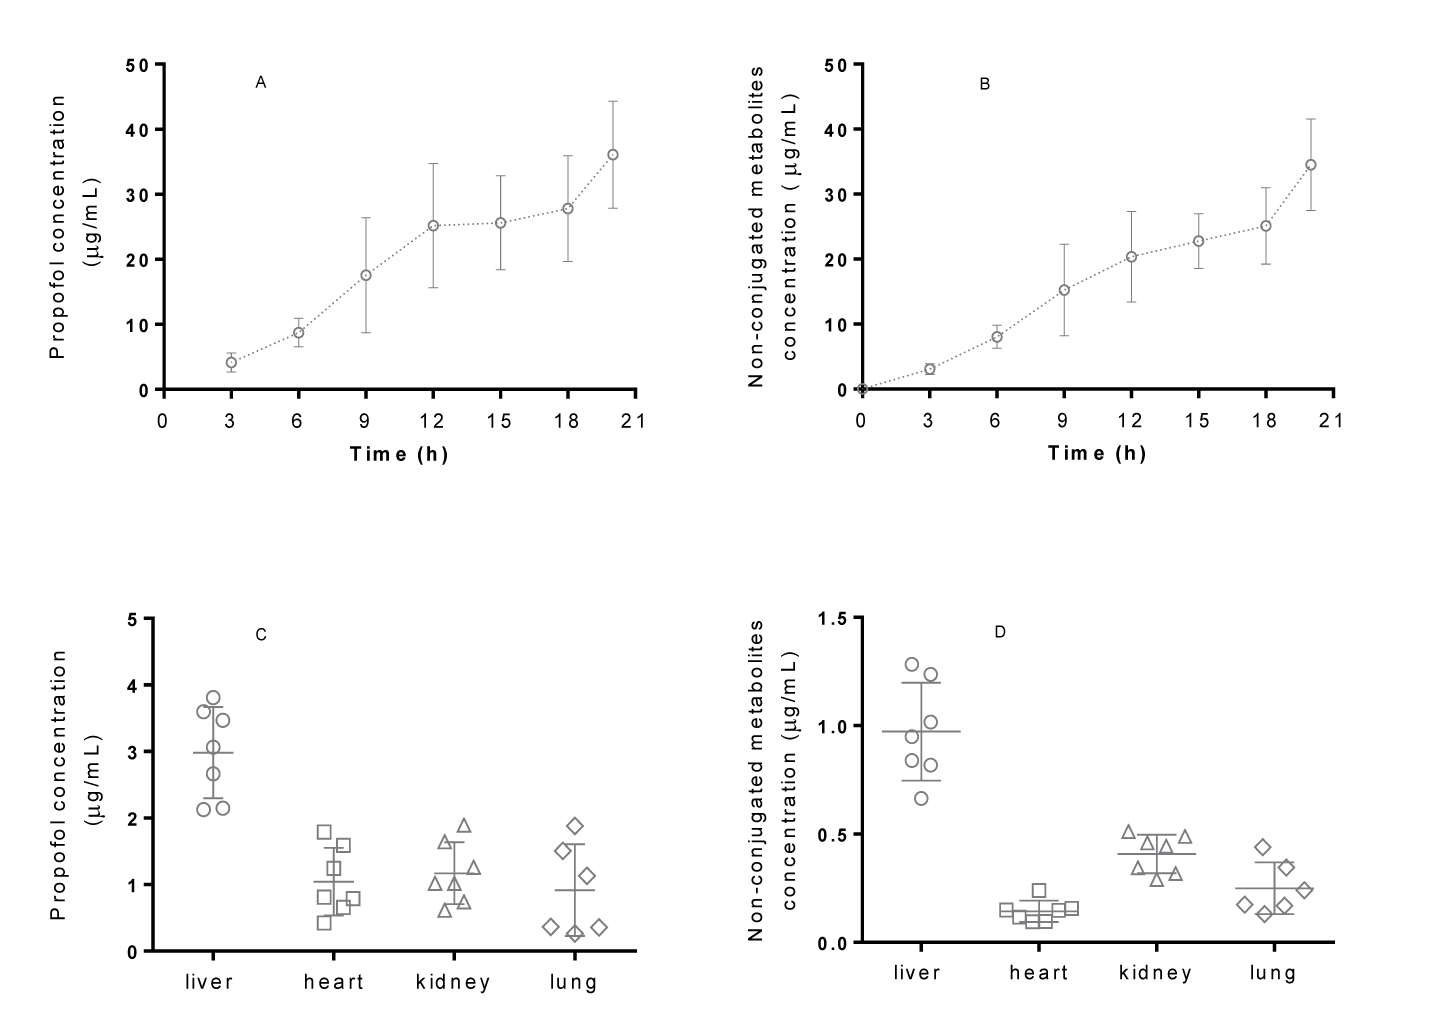
| Figure 3: Plasma concentrations (mean ± SD) of propofol (A) and its non-conjugated metabolites (2,6-diisopropyl-1,4-quinol + 2,6-diisopropyl-1,4-quinone) (B) measurements along the 20h of continuous anesthesia in the six animals; mean is represented by the middle circle and the extreme horizontal limits show the standard deviation range. Propofol and non-conjugated metabolites concentrations obtained in each animal (n=7), in different tissues (liver, heart, kidney and lung) are represented in plots C and D; each symbol (circle, square, triangle and rhombus) represents the propofol/ non-conjugated metabolites measured in one animal; the middle horizontal line show the mean and the extreme horizontal lines delimit the standard deviation (SD). |