 |
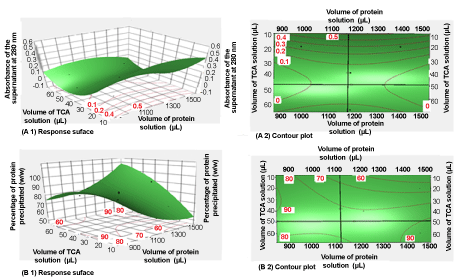
| Figure 1: Three-dimensional responses surface (A1), and contour plot (A2) showing the supernatant absorbance data (A) and those of the percentage of protein precipitated (B1 and B2) as a function of volume of protein solution and volume of TCA solution. The intersections of the two orthogonal lines, in figures (A2), and (B2) are the saddle point. |