 |
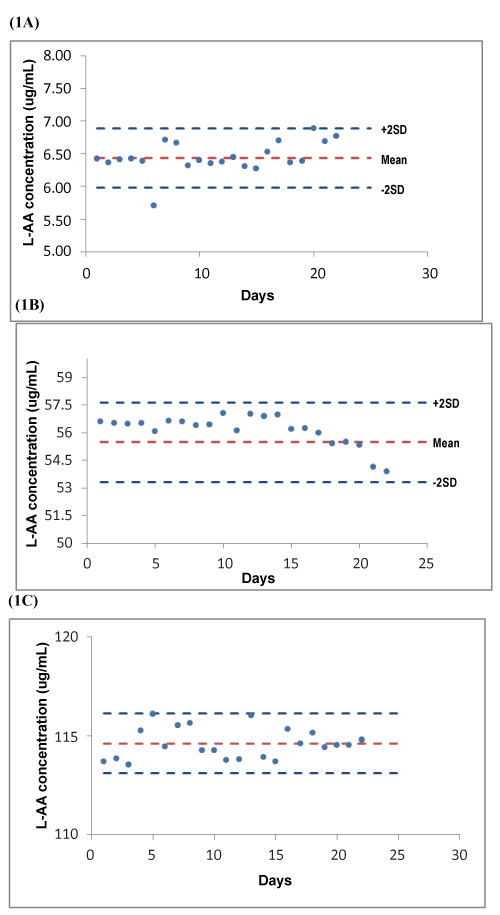
| Figure 1: Evaluation of stability of QC samples: (A) QC1 (6.5 μg/mL); (B) QC2 (55 μg/mL); (C) QC3 (115 μg/mL). The results from the QC charts (Figures 1A, 1B and 1C) indicated on going, consistent good performance of the HPLC method in generating accurate and precise results. |