

 |
 |
 |
 |
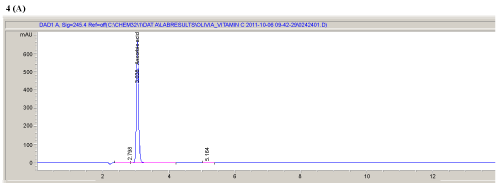
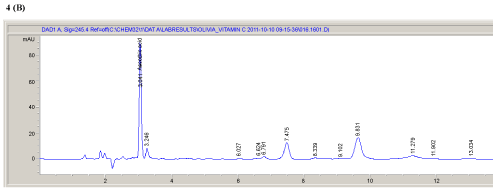
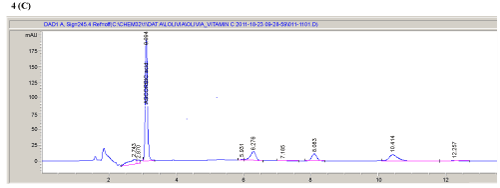
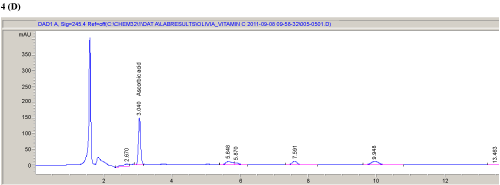
| Figure 4: Representative chromatograms illustrating specificity of (A) 50 μg/mL L-AA standard; (B) Cereal extract (C) Tomato extract; and (D) Stressed tomato extract. Comparison of retention times and resolution of L-AA peak of L-AA standard to samples were demonstrated. |