 |
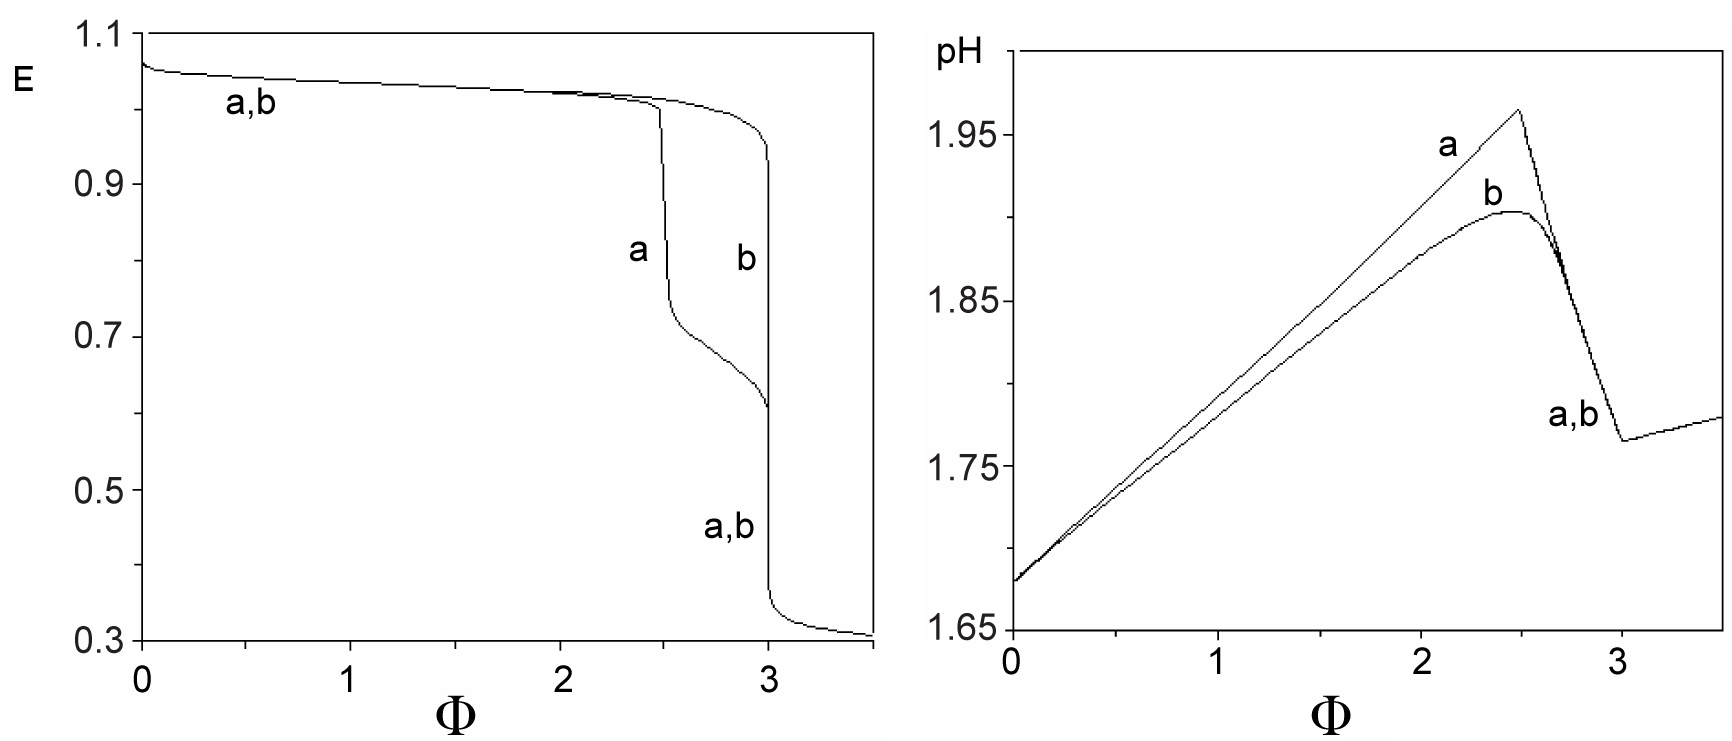
| Figure 1: The plots of relationships: (A) E=E(Φ) and (B) pH=pH(Φ) for the system KIO3 (C0=0.01 mol/L) + HCl (Ca=0.02 mol/L) + H2SeO3 (CSe=0.02 mol/L) + HgCl2(CHg mol/L) as D titrated with V mL of C=0.1 mol/L ascorbic acid (C6H8O6) as T; curves a are plotted for CHg=0 mol/L, curves b – for CHg=0.07 mol/L in D [17]. |