 |
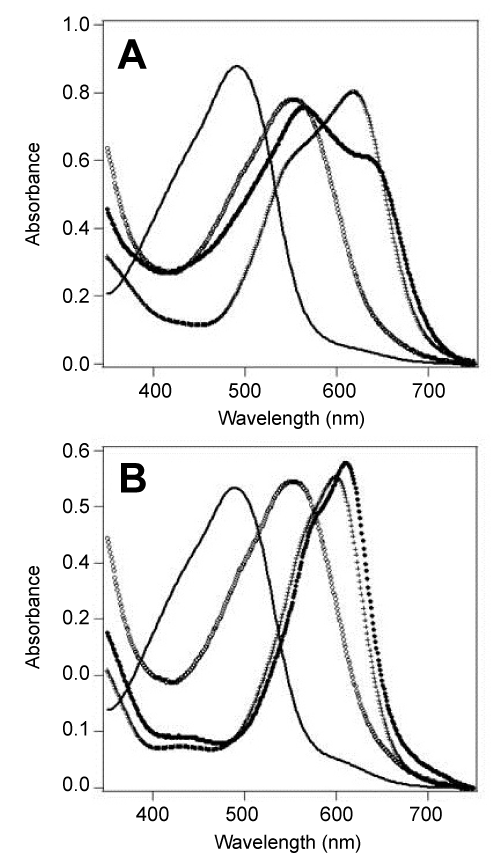
| Figure 3: Absorption spectra after zincon and metal addition to human serum albumin (HSA). (A) The spectrum of the zincon solution is represented by the plain line. The open diamonds, crosses, and closed circles represent data points in the spectra of HSA, zincon with 80 μM Zn2+, and purified HSA mixed with 80 μM Zn2+ and zincon, respectively. The absorbance in the spectrum of the purified HSA is magnified by ×6. (B) The spectrum of zincon solution is indicated by a plain line. The open diamonds, crosses, and closed circles represent data points in the spectra of HSA, zincon with 40 μM Cu2+, and purified HSA mixed with 40 μM Cu2+ and zincon, respectively. The absorbance in the spectra of zincon with Cu2+ and purified HSA have been magnified by ×3 and ×6, respectively. |