 |
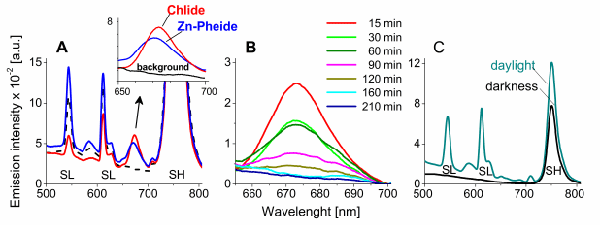
| Figure 2: The emission spectra of tumors after administration of Chlide and Zn−Pheide, recorded in real-time mode. (A) Fluorescence spectra recorded in vivo from tumors after the Chlide, Zn−Pheide or carrier alone (PBS, water and ethanol) administration. In the inset the expanded region 650-700 nm is shown. (B) The emission spectra of the highest amplitude, selected from a series of measurements recorded for each time point. The spectra were recorded in vivo from a single tumor at various time intervals after Chlide administration (i.v., 2 mg/kg). (C) The emission spectra of human skin measured after excitation at 380 nm in daylight and in the darkness (see the text for details). SL - stray light, SH - second harmonic. |