 |
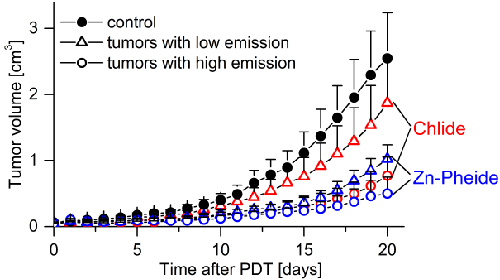
| Figure 6: Correlation of the kinetics of S91 tumors growth after PDT with the intensity of photosensitizer fluorescence in the tumors before irradiation.The tumors were divided into two groups using the mean value of the signal intensity (i.e. 52 a.u.), measured just prior irradiation. Control tumors grew in the animals not treated with photosensitizer. Bars indicate the variance of tumor volumes which increases with the tumor size. |