|
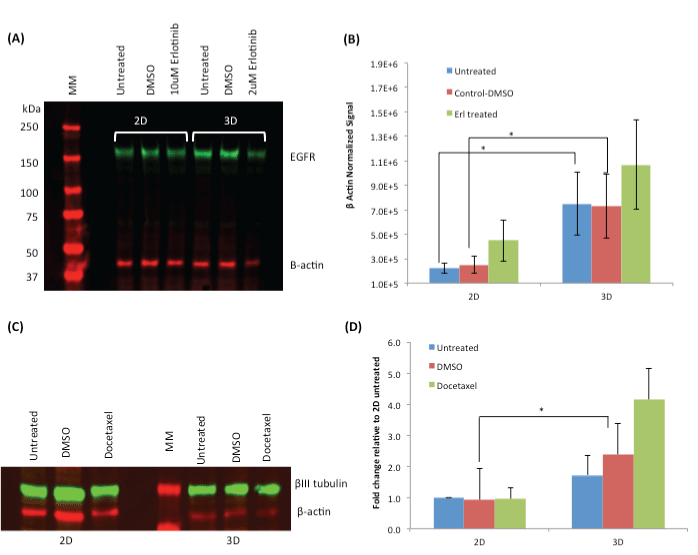
| Figure 6: Western blot results. (A) A representative image of the expression of total EGFR in 2D and 3D cultured CAL27 cells, untreated, DMSO controls, and treated with Erlotinib at its IC50 (10 µM and 2 µM for 2D and 3D cells, respectively) for 48 h. The whole cell lysate was subjected to western blot analysis. (B) The relative expression level of EGFR in 3D cultured cells compared to 2D cells, and between untreated, DMSO control, and drug-treated cells in each culture type. (C) A representative image of the expression of βIII tubulin in 2D and 3D cultured DU145 cells, untreated, DMSO controls, and treated with Docetaxel at its IC50 (0.04 µM and 0.1 µM for 2D or 3D cells, respectively) for 48 h. The whole cell lysate was subjected to western blot analysis. (D) The relative expression level of βIII tubulin in 3D cultured cells compared to 2D cells, and between untreated, DMSO control, and drug-treated cells in each culture type. Data in (B) and (D) were results averaged from triplicate experiments. *P<0.05 using t test. |