 |
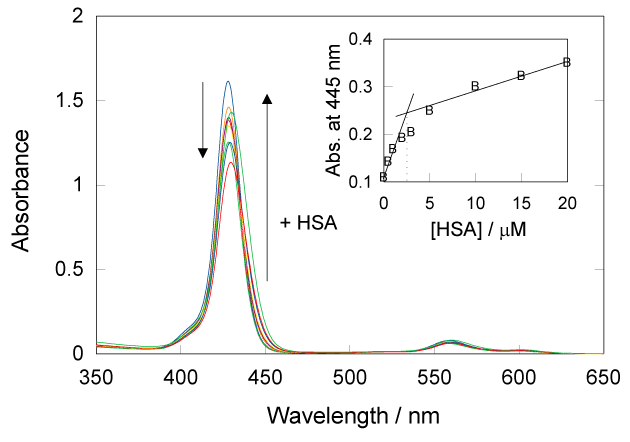
| Figure 2: Absorption spectra of DDP (V) TPP with or without HSA. The sample solution contained 5 µM DDP (V) TPP and indicated concentration of HSA in a 10 mM sodium phosphate buffer (pH 7.6). Inset shows the relationship between the absorbance of DDP (V) TPP at 445 nm and the HSA concentration. |