 |
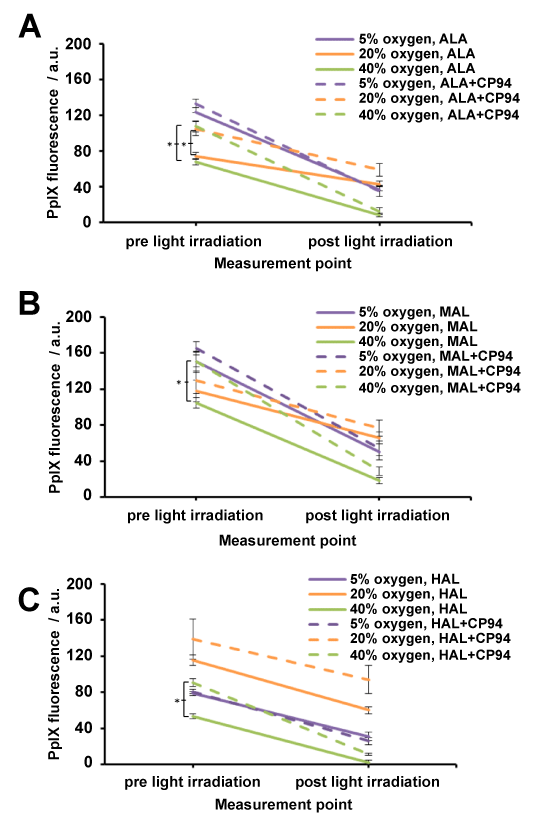
| Figure 1: Levels of PpIX fluorescence measured prior to (pre) and following (post) light irradiation of U-87 MG glioma cells subjected to 5, 20 or 40% oxygen and incubated with: (a) 250 μM ALA ± CP94, (b) 1000 µM MAL ± CP94 and (c) 10 μM HAL ± CP94. Data represents the mean of 5 wells ± 1 standard deviation, carried out in triplicate (n=3). *represents a statistically significant accumulation of PpIX between cells incubated with ALA/MAL/HAL alone and cells incubated with ALA/MAL/HAL+CP94 (p<0.05). |