 |
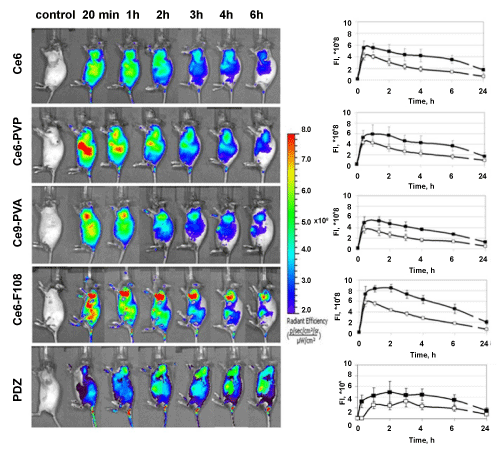
| Figure 1: in vivo monitoring of fluorescence signal distribution after i.v. injection of Ce6 and its complexes with PVP, PVA and F108, and PDZ into CBA mice with the s.c. mouse cervical carcinoma. A – serial fluorescence images of mice (ex. 640 nm, detection 720 nm), B – quantification of the fluorescence signal (FI) in the tumor (■) and normal tissues (□). FI values at selected time point after injection were normalized to its corresponding value measured before the injection. Data are expressed as mean ± SD (n = 3 mice per group). |