 |
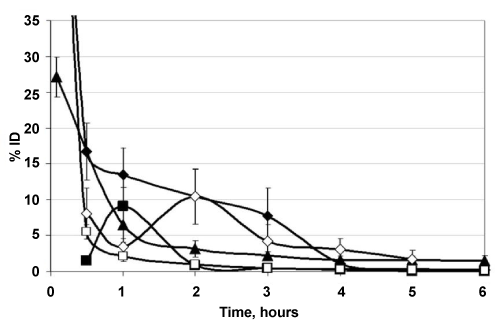
| Figure 3: Concentration of Ce6 in plasma as a function of time after intravenous injection of Ce6 (♦), Ce6-PVP (■), Ce6-PVA (□), Ce6-F108 (▲), and PDZ (◊) into CBA mice with the s.c. mouse cervical carcinoma. Data are expressed as mean ± SD (n = 3 mice per group). |