 |
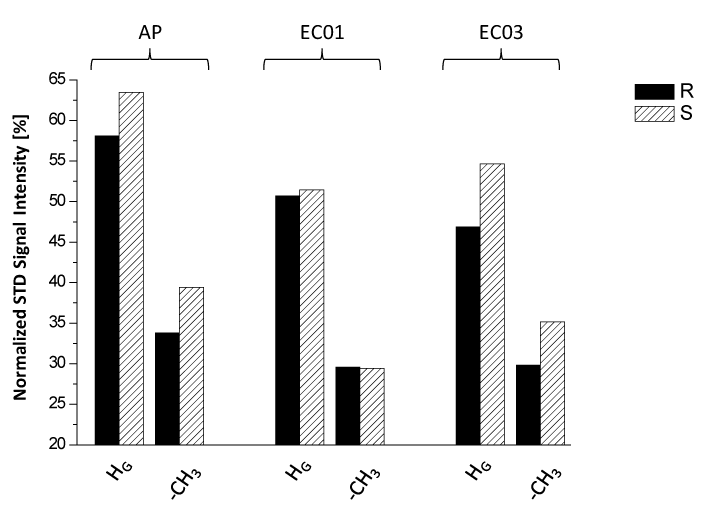
| Figure 6: Bar diagram reflecting the normalized STD signal intensities of HG at the stereogenic center and of the methyl group for (R)- (solid bars) and (S)-flurbiprofen enantiomers (hatched bars) in presence of the amylose-based CSP (AP), Eurocel 01 (EC01) and Eurocel 03 (EC03) recorded in methanol-d4 (+ 0.1% deuterated TFA). |