 |
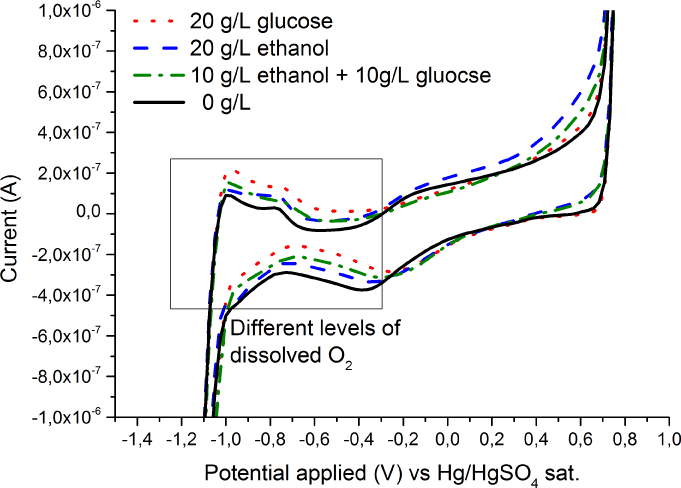
| Figure 4: Cyclic voltammogramms of a platinized Pt micro-electrode with 0 g/L (continuous line), 20 g/L glucose (dotted line) and 20 g/L ethanol concentration (dashed line), as well as a mixture of ethanol and glucose with both 10 g/L (dashed and dotted line) in filtered fermentation medium 2, as shown in Table 2, with pH 5.3. The box highlights the different levels of dissolved oxygen affecting the CVs at lower applied potentials. |