 |
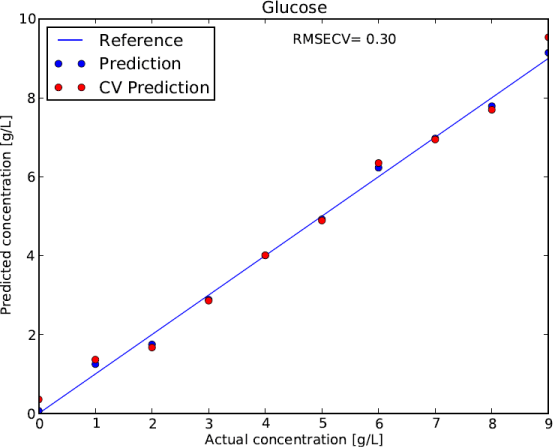
| Figure 6: Prediction plot of a two component PLS regression based on cyclic voltammetry data of a glucose concentration series between 0 and 9 g/L in filtered fermentation medium 2 at pH 5.3. The line indicates perfect agreement between the predictions of the PLS model and the actual concentration. The blue dots indicate the deviation of the prediction when using all data points in the model. The red points visualize the deviation of the model if all data points are included in the model, except the one that is being predicted, called leave one out cross validation (CV). The latter is a stronger metric of the validity of the model and the basis of the root mean square error of cross validation (RMSECV) of 0.3 in the present case. |