 |
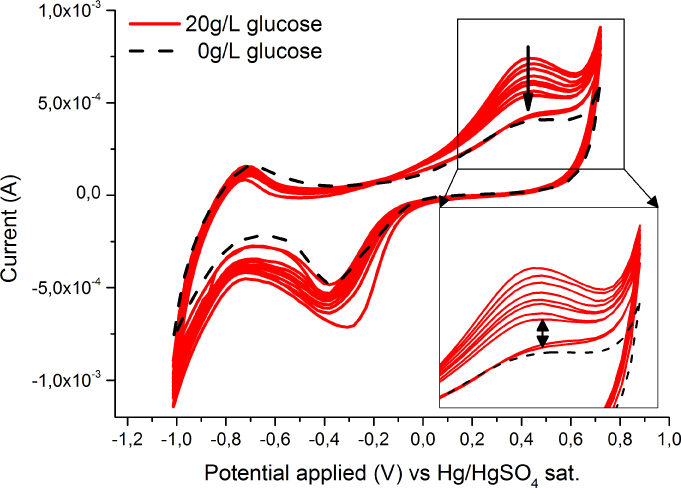
| Figure 7: Degradation of the glucose signal (continuous line) in the cyclic voltammogramm of a palladized Pd sheet electrode in filtered fermentation medium 2, as shown in Table 2, with pH 5.3 and 20 g/L glucose. For comparison the CV of medium 2 without glucose is plotted as well (dashed line). The arrow indicates the decay of the signal. The inset highlights an especially large decay step. |